Reports, cards and presentations
Build reports with the columns and filters you want, charts with cards, and presentations with many cards together.
Under the Analytics menu you find three tools for seeing your data together:
- Reports: tables with the columns, filters and sorting you want, e.g. all contacts with their contact details.
- Cards: charts, e.g. contacts by city or sales by month.
- Presentations: many cards together on one page.
Reports
Reports are organised in folders. A new company starts with a folder for each object, e.g. "Contact reports", sometimes with ready-made reports inside.
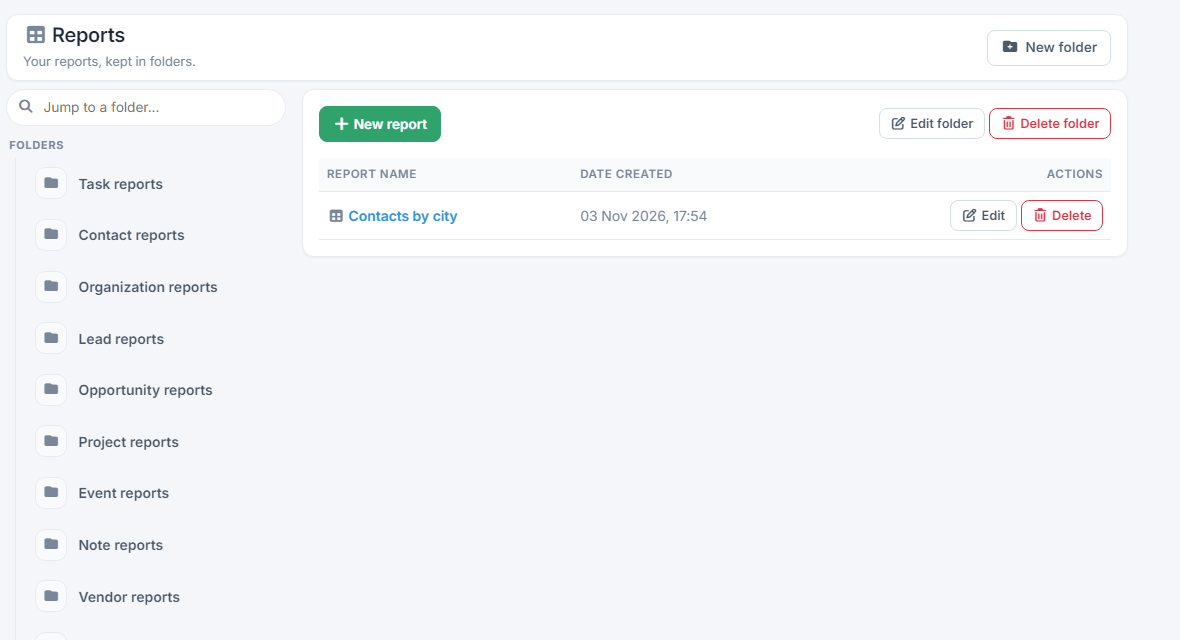
- New folder creates your own folder. Edit folder renames it, and Delete folder deletes it together with all its reports.
- New report asks for a Report name and an Object, and the report is created in the folder you have open. Two reports in the same folder can't have the same name.
- Edit on a row changes the report's name or moves it to another folder.
Designing a report
Click the report's name and then Edit.
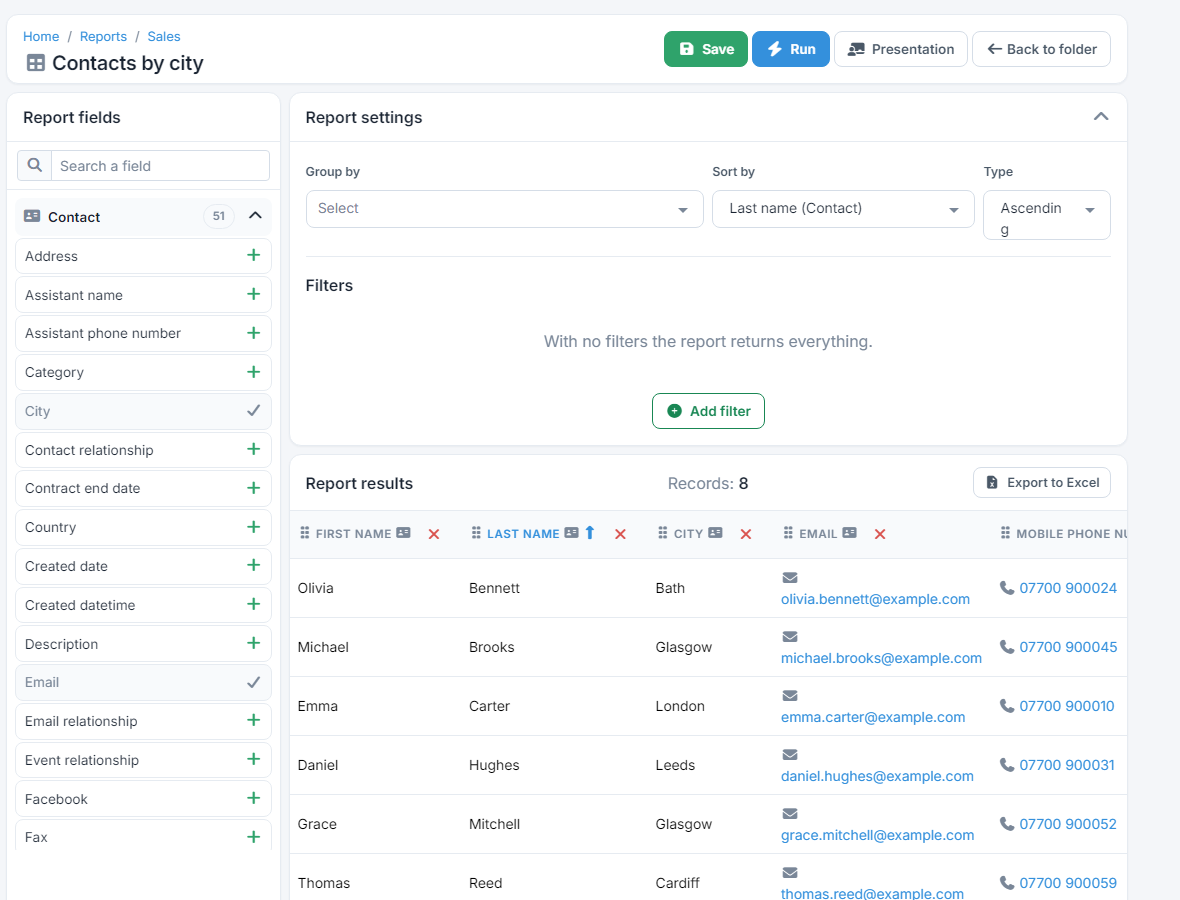
- On the left, under Report fields, are the fields of the object and of its related objects. Click a field to add it as a column. Drag the columns to change their order, and the × removes them.
- Under Report settings you set Group by a field, with a total per group, and Sort by one column, ascending or descending.
- Add filter narrows the records, e.g. only the contacts in London. Without filters the report shows every record.
- Run shows the results with your changes, and Save keeps them. Presentation opens the report in a new tab, as others see it.
Results and export
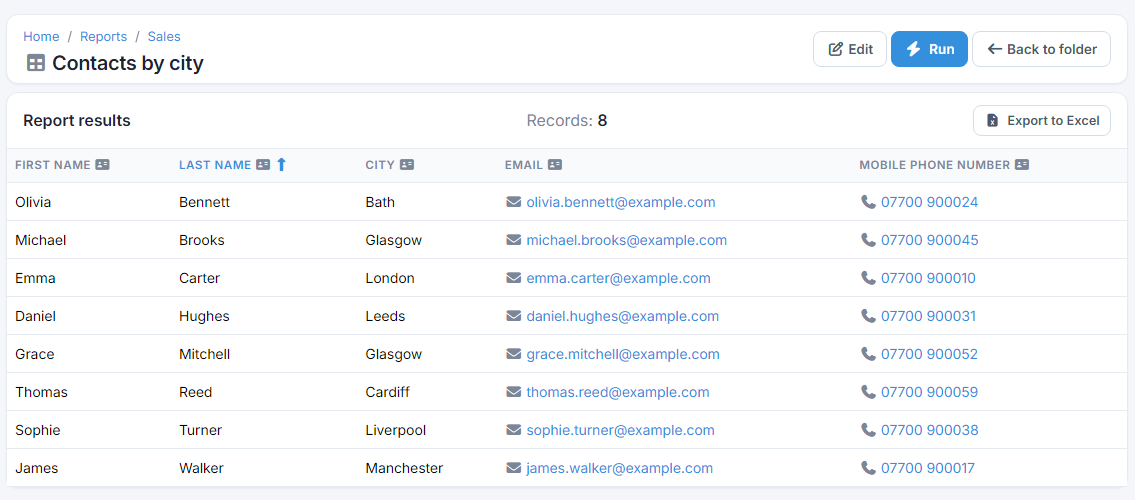
- Records shows how many records were found. The page shows the first 300.
- Export to Excel gives you every record in the report, with its filters. The export runs in the background and the file comes by email.
- Each user only sees the records they're allowed to see in the results.
Reports per object have a limit per plan: Free 1, Basic 10, Plus 25, Professional 50, Enterprise 100.
Cards
Under Cards you see the company's charts. A new company already has a few, e.g. "Tasks by stage". Press New card:
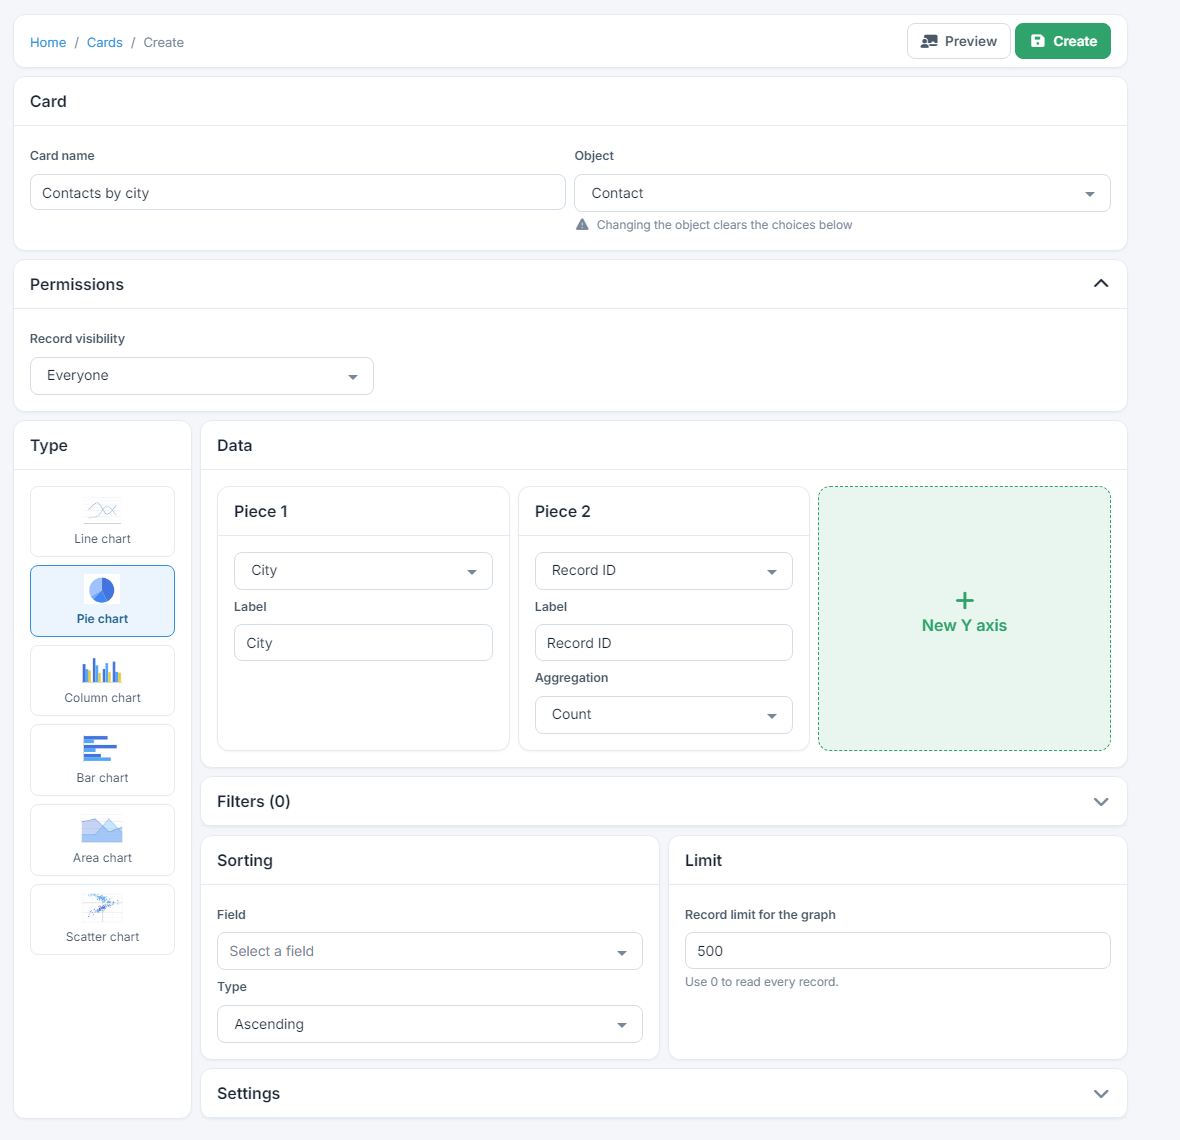
- Card name and Object, e.g. Contact. If you change the object, the choices below are cleared.
- Type: Line chart, Pie chart, Column chart, Bar chart, Area chart or Scatter chart.
- Data: on the X Axis the field that splits the values, e.g. City, and on the Y Axis what you measure, with an Aggregation of Sum, Count, Minimum, Maximum or Average. A field that isn't a number can only be counted. New Y axis adds more series, up to 15. On a pie chart the axes are called Piece.
- If the X axis is a date, you group by Day, Month or Year, e.g. turnover per month.
- Filters, Sorting and Limit: which records count, in what order, and at most how many (500 at first, 0 for all).
- Under Settings you change the axis titles, the size, the legend position, the prefix or suffix of the values (e.g. €) and the decimals.
- Under Permissions you set who sees the card: everyone, only you, a team or specific users.
Preview shows the chart before you save it, and Create keeps it.
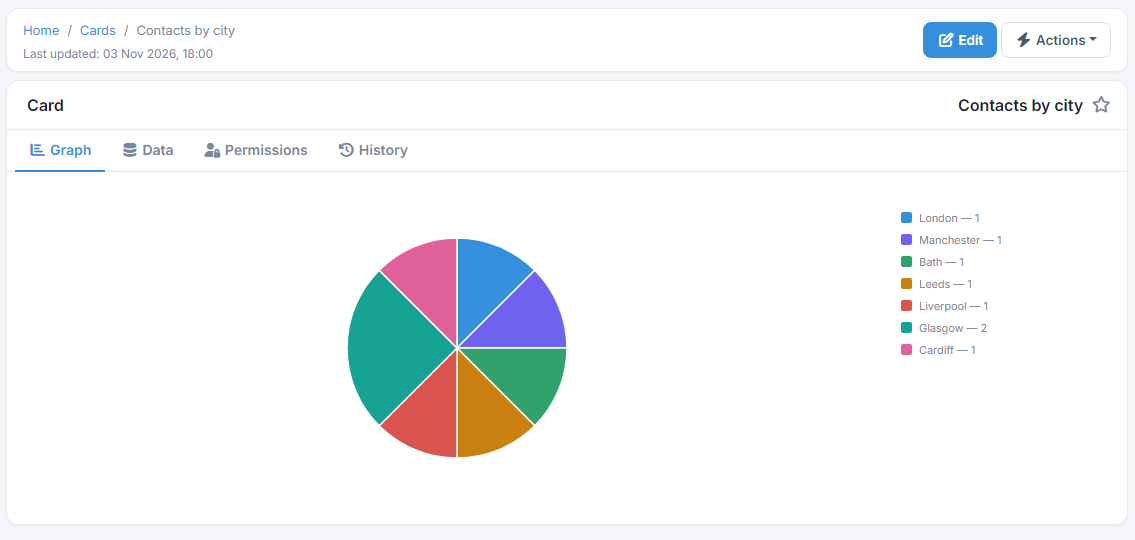
On the card's page, Edit changes it, and from Actions you clone or delete it. A deleted card goes to the recycle bin.
Presentations
A presentation gathers up to 12 cards on one page, e.g. for a monthly meeting. Press New presentation, give a Presentation name and a Description, and with Add card choose cards and the width of each, from 3 to 12 columns (12 is the full width).
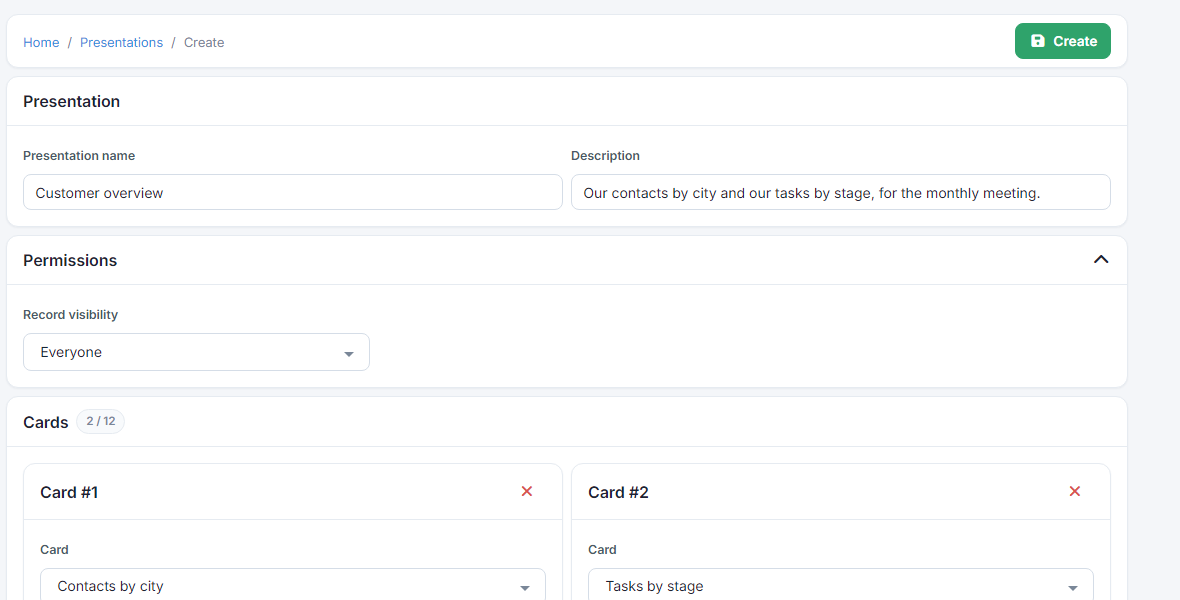
Press Create. Refresh reloads the data of all its cards.
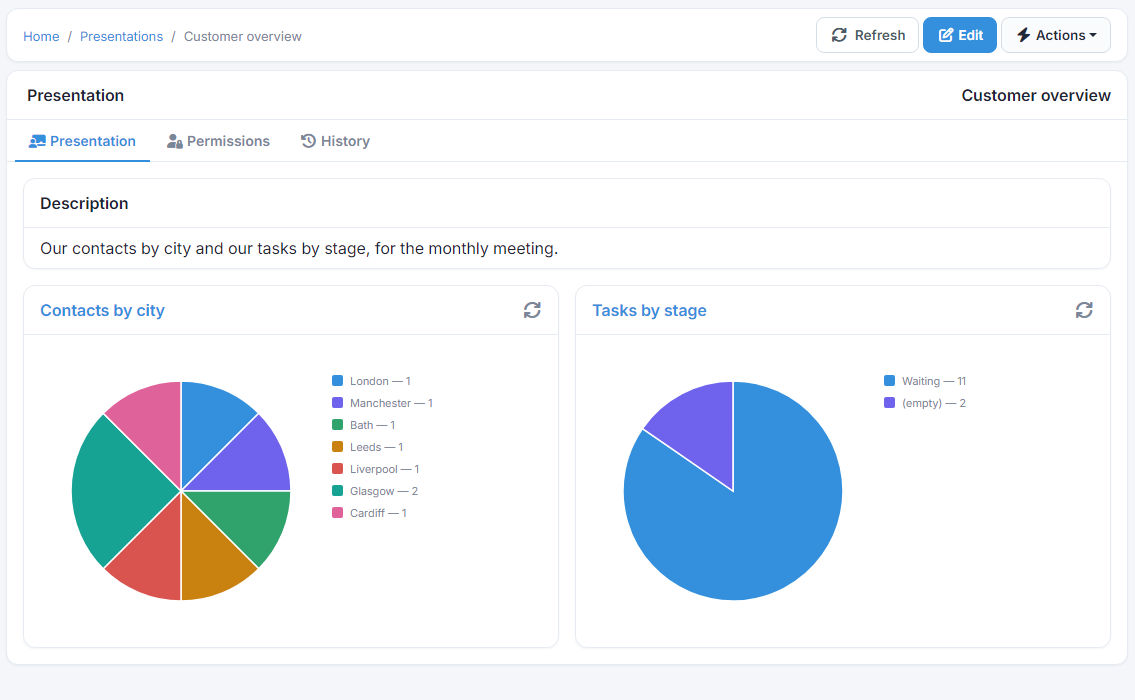
A presentation shows each user only the cards they're allowed to see.
Permissions
Each tool needs the matching permissions in your profile, on the Report, Card and Presentation objects, and permission to see the object they take data from. If your profile can't see Opportunities, you don't see reports and cards about them either. See the guide User profiles.